Reports & Analytics
Reports & Analytics is where you turn your HR data into something useful — ready-made reports you can run and export, and visual dashboards that show trends at a glance. The page has two tabs: Reports (run and export data reports) and Analytics (interactive dashboards).
What you can do here:
- Run pre-built reports across People, Leave, Attendance, Payroll, and more
- Search for a specific report by name
- Open a report, set its filters, and export the results
- View analytics dashboards for attendance, leave, payroll, and headcount
- Build your own custom report with the report builder
Running a report never changes your data — it only reads the database to produce a result. It’s completely safe to run any report and experiment with the filters.
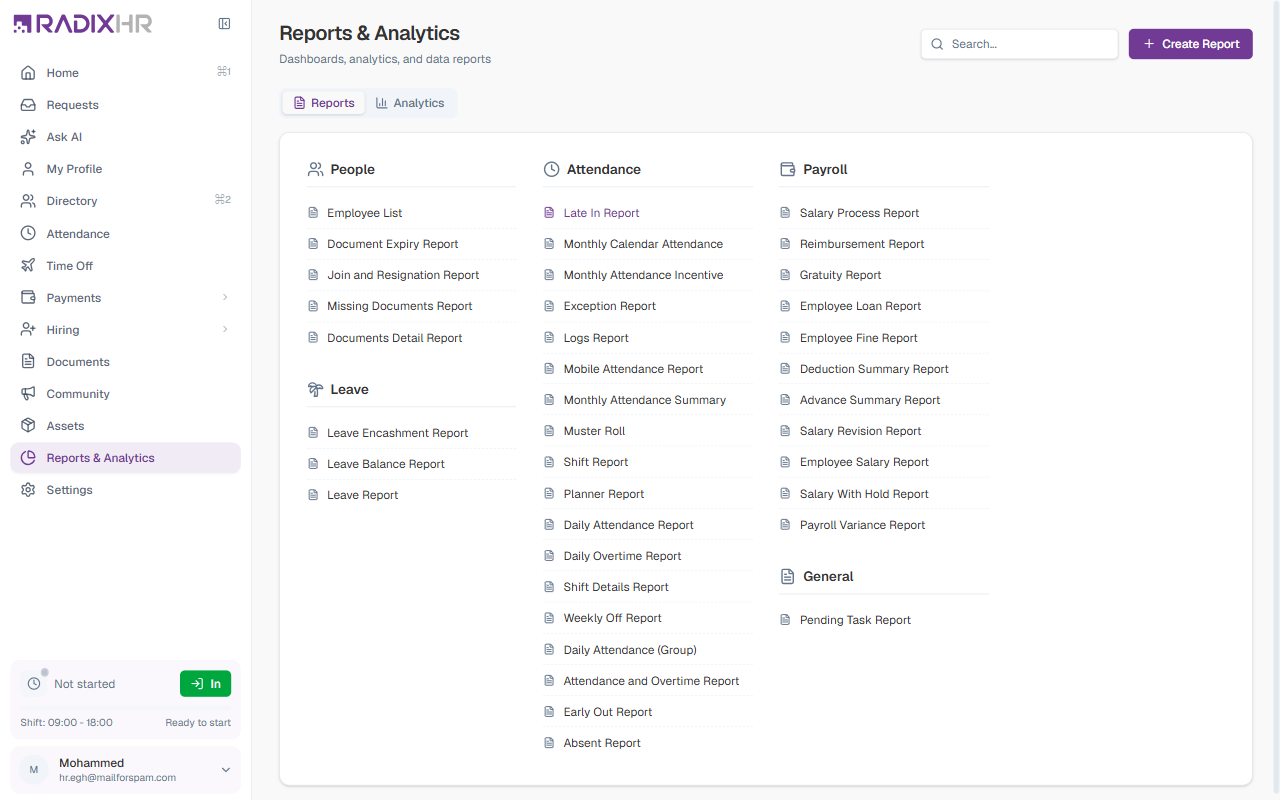
The Reports Tab
The Reports tab lists every pre-built report, grouped by category. Use the Search box at the top to find a report by name, or browse the categories.
| Category | Example reports |
|---|---|
| People & Documents | Employee List, Employee Directory, Document Expiry Report, Documents Detail Report, HR Document Tracker, Join and Resignation Report |
| Leave | Leave Encashment Report, Leave Balance Report, Leave Report |
| Attendance | Late In Report, Monthly Calendar Attendance, Daily Attendance Report, Daily Overtime Report, Absent Report, Muster Roll, Shift Report, and more |
| Payroll | Salary Process Report, Reimbursement Report, Gratuity Report, Employee Loan Report, Deduction Summary Report, Payroll Variance Report, and more |
| General | Pending Task Report |
Click any report name to open its run page.
The exact list of reports depends on which modules your workspace uses and the permissions you have.
How to Run a Report
- On the Reports tab, click the report you want
- Its run page opens with a Parameters & Filters panel at the top
- Set the filters you need (for example, a date range, specific employees, or locations)
- Click Run
- The results appear in a table below
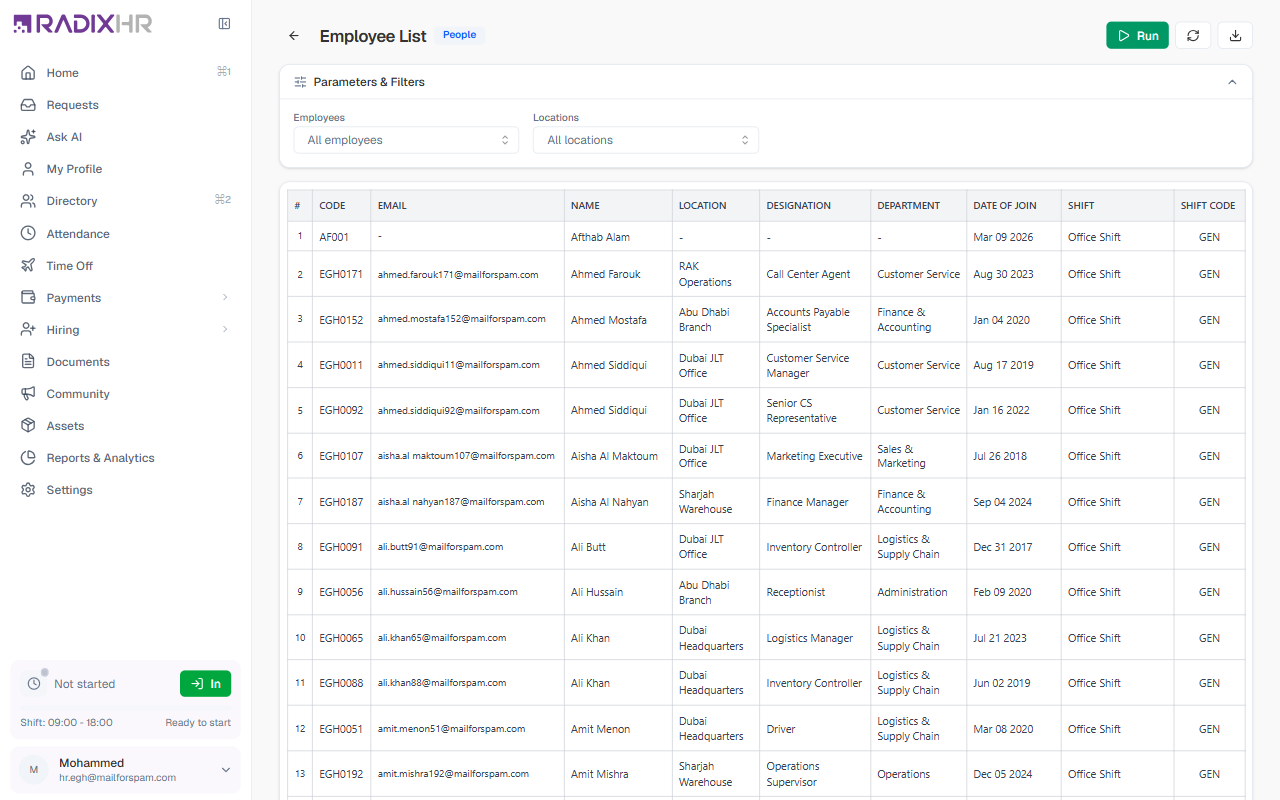
The report run page has these controls in the top-right:
| Control | What it does |
|---|---|
| Run | Generates the report using the current filters |
| Refresh | Re-runs the report to pull the latest data |
| Download | Exports the results to a file |
The results table at the bottom is paginated — you can set how many rows show per page and move between pages.
If a report comes back empty, check the Parameters & Filters panel first. Too narrow a date range, or a filter that excludes everyone, is the most common reason a report returns no rows.
The Analytics Tab
The Analytics tab gives you interactive dashboards instead of plain data tables. Each card opens a dashboard full of charts and key numbers.
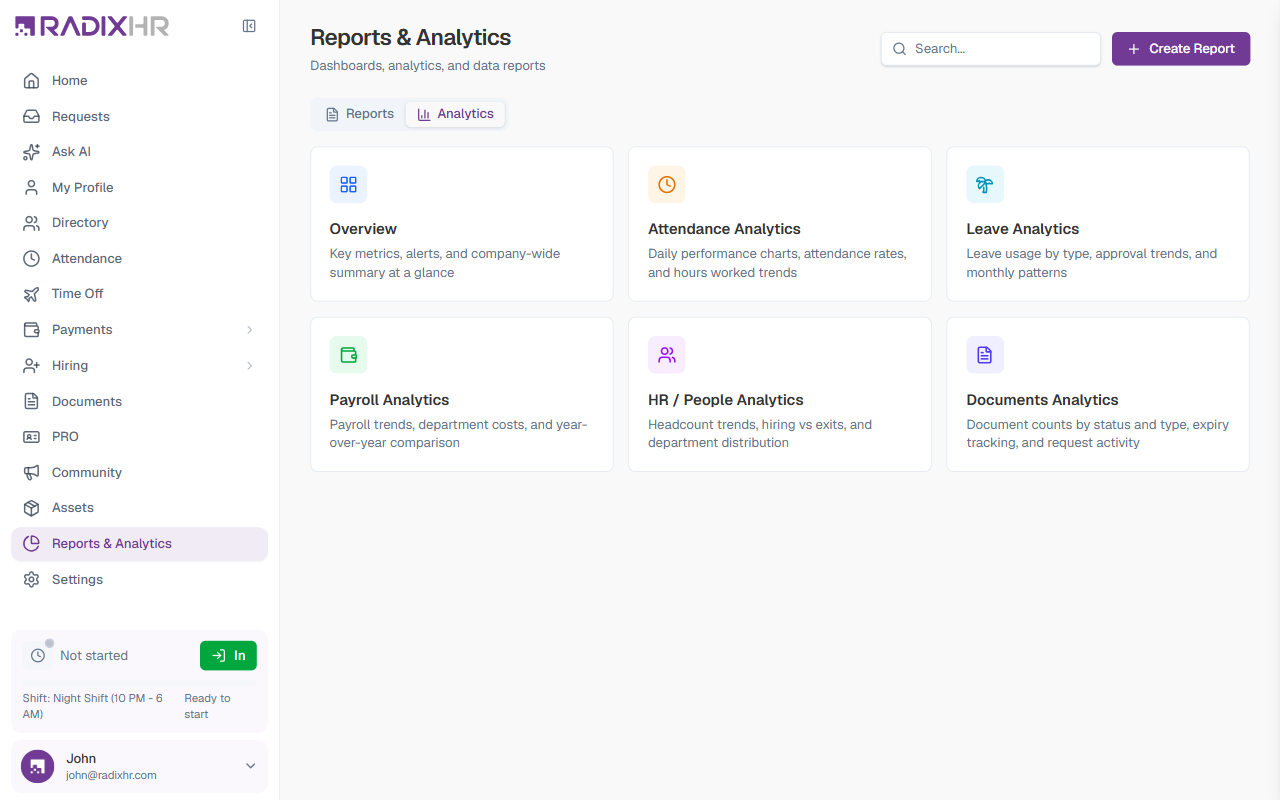
| Dashboard | What it shows |
|---|---|
| Overview | Key metrics, alerts, and a company-wide summary at a glance |
| Attendance Analytics | Daily performance charts, attendance rates, and hours-worked trends |
| Leave Analytics | Leave usage by type, approval trends, and monthly patterns |
| Payroll Analytics | Payroll trends, department costs, and year-over-year comparison |
| HR / People Analytics | Headcount trends, hiring vs. exits, and department distribution |
| Documents Analytics | Document counts by status and type, expiry tracking, and document-request activity |
Click a card to open its dashboard.
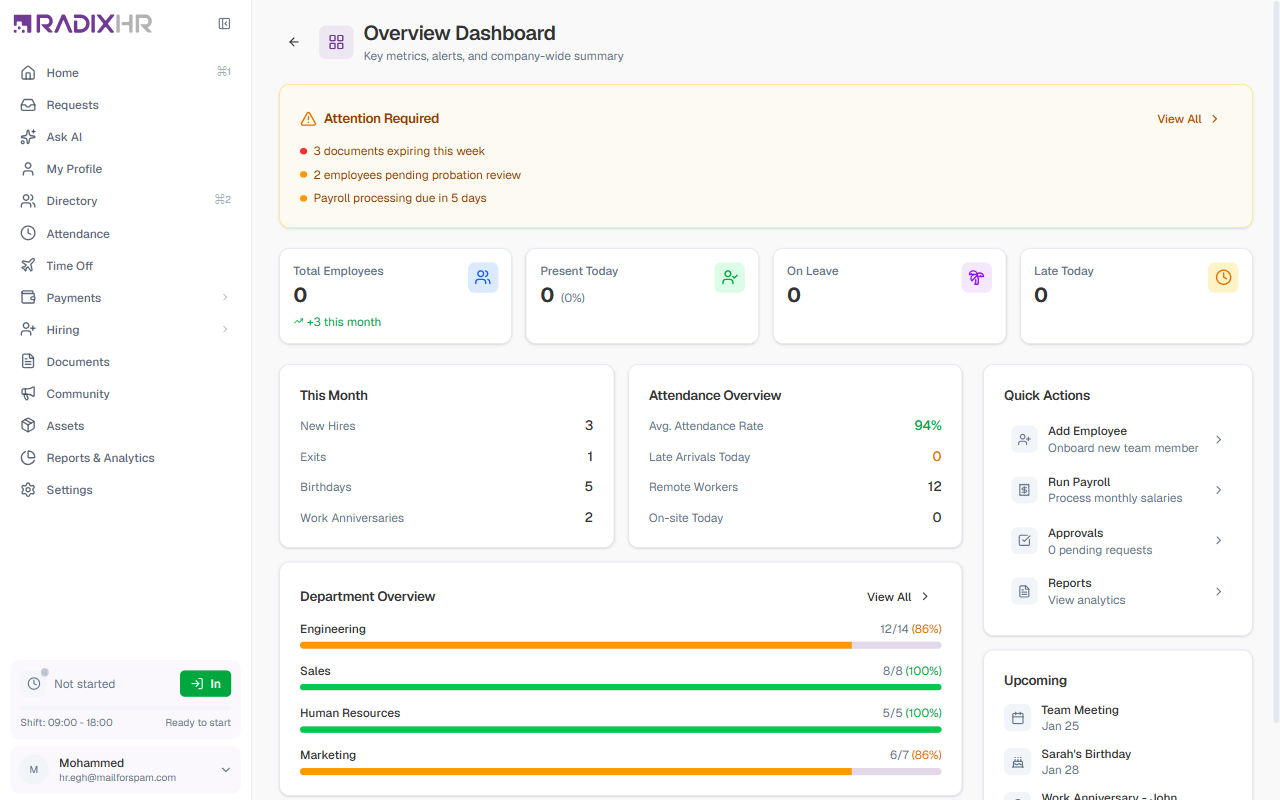
Example: the Overview Dashboard
The Overview dashboard pulls the most important numbers into one screen — an Attention Required panel for things needing action, headline counts (total employees, present today, on leave, late today), a monthly summary (new hires, exits, birthdays, anniversaries), a department breakdown, and quick action shortcuts.
Creating a Custom Report
If the pre-built reports don’t cover what you need, you can build your own with the report builder. Click Create Report in the top-right corner of the page.
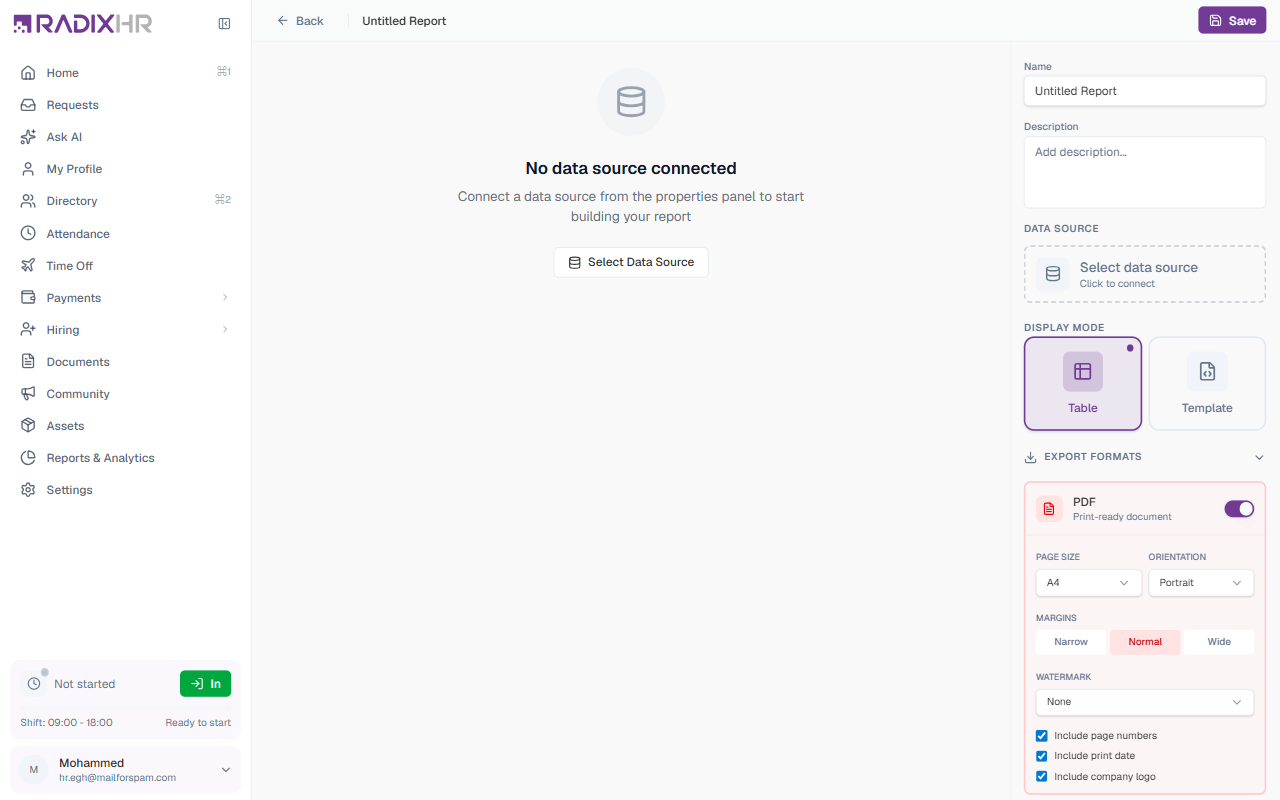
In the report builder you:
- Give the report a Name and an optional Description
- Connect a Data Source — the set of data the report draws from
- Choose a Display Mode — Table (a data grid) or Template (a formatted layout)
- Set the Export Formats — for example PDF, with page size, orientation, margins, watermark, and whether to include page numbers, the print date, and the company logo
- Click Save
Once saved, your custom report appears alongside the pre-built reports on the Reports tab.
Building a custom report is an advanced task. If a pre-built report is close to what you need, run that and adjust its filters first — it’s usually faster than building one from scratch.